Candlestick Patterns are chart-based technical tools used in trading. This tool helps the traders to form an idea of what the price movements are going to be and in which direction in the future.
This is an ancient technical trading tool that first originated in Japan in the 18th century but continues even today. This trading tool was first used by the Japanese rice traders. Know more trades in dubai
Subsequently, the Candlestick Pattern started getting applied in different other trades including in stock-dealing in the money market. It helps traders to create a database of price fluctuations to understand what the trading pattern is likely to be in the future.
This trading tool is used by traders daily. They can get a complete view of a day’s price movement. If you collect the daily data for about a week, you know in which direction the prices would move in the future.
Why is Candlestick Pattern Useful To Understand Price Swing?
The traditional tool to understand the futuristic trend in price movement is OHLC. This acronym stands for:
- O: Open
- H: High
- L: Low
- C: Close.
The OHLC pattern is certainly useful for traders. It had been continuing for decades together. Colour coding of candles is used in Candlestick Pattern.
But the current tendencies of frequent fluctuations in prices caused by variations in gold and oil prices, changes in the trading policies of different countries, and disturbances in bilateral trade relations between two or more countries necessitate the application of exact analytical tools for decision-making.
Candlestick Pattern is useful for the following reasons:
- It builds an independent pattern to predict price movements in exact ways.
- Each candle gives a particular day’s price movement.
- By studying this trend of price movement, a trader can form a long-term trading strategy.
- Daily price swings can be understood in a better way.
- Previous or past price movement patterns can help a trader determine futuristic price movement.
How Can You Interpret Colours Of A Candlestick Pattern?
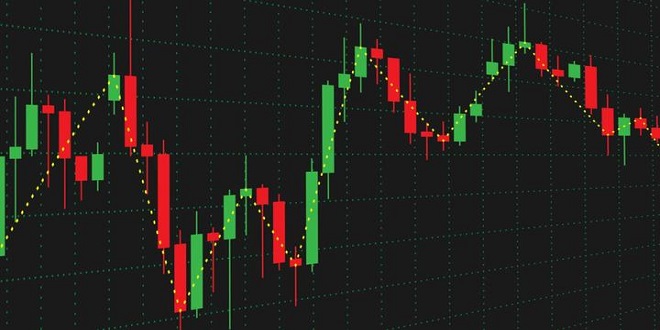
A typical daily Candlestick Pattern is based on the OHLC. Different color codes are used to represent the market mood and investment sentiments. Mainly two types of colors are used in this market analytical tool.
They are:
- Dark Colour: if the candle is Dark, usually represented through Red or Black, it indicates that prices are falling.
- Light Colour: if the market sentiment is Bullish, you have light-colored candles (usually in White or Green). This is an indicator of an upward trend in prices.
What Are The Common Terms Used in Candlestick Patterns?
In the Candlestick Pattern of trading, there are certain terms had been getting used for decades together. These terms continued for decades together. There are a large number of such terms.
We are listing below some of the important terms used in this format of market prediction:
Hammer
Hammer means Hammering Out A Bottom. This indicates the downward movement of prices. This Bullish pattern indicates the possibility of Directional Change in prices.
Hanging Man
This pattern indicates a notice-worthy potential reversal lower and a tendency of the developing market mood to fight back the downward trend.
Island Reversal Or Abandoned Baby Top/Bottom
This pattern indicates a major reversal in the prior directional movement, a gap in the direction of the current trend. It may also indicate that the selling interest has emerged as the dominant market force.
Long Tails and Small Bodies
A small body candlestick is known as Doji. This shows the existing market mood of the tendency by the traders to fight back the tendency of falling prices to push it up to what it was in the Open (Opening Price).
Morning Star
Three candles are used to indicate this pattern. It has one candle with a short body between one long Red and a long Green candle. This indicates a possible Bullish trend in the stock market with a reduced trend in the selling of shares.
Three White Soldiers
This indicates an upcoming Bullish tendency in the market. This pattern is shown by positioning a set of three candles in Green colors. They have small wicks.
What Is The Importance of Candlestick Pattern For Intraday Traders?
The Intraday traders in a stock market, mainly in Asia, had been monitoring this analytical pattern for decades together to take an investment decision.
Since the trading activities of an Intraday trader involve a particular day, they follow this pattern of analysis. An Intraday trader buys shares when the prices are low and sells them when there is a little upward variation in prices.
They can understand the market sentiment based on the price movement of an individual company share or stocks of several companies in which they invest. Candle formations tell them the day’s market mood.
They can use this information to take a decision for a day. This is due to the reason that an Intraday trader usually adopts the following means to book profit:
- Buy stock at a low or comparatively low price
- Sell the stock at a higher or marginally higher price.
The trader’s activity is limited to a single day. As a result, the trader can take the sell or buy decision gaining knowledge from the positioning of the candles. Know more buy crypto
Conclusion
Candlestick Pattern, mainly popular in Asia but also used elsewhere in the world, is useful as (price) Momentum Indicators and (price) Analyzing Charts. This is an ancient market information system.
This is very useful as it alerts traders about impending or potential changes in market prices. Colour Coding of candles plays an important role in depicting the market mood (as expressed in price fluctuations).
This analytical pattern is generally considered reliable by traders. The credit for discovering this ancient market tool goes to Homma, a Japanese trader.
Homma focused on the factor of Neutrality as a major market sentiment of investors. Today, we term this Neutrality as an Indecision on the part of traders. This Indecision falls in between Bullish and Bearish traders.